Reading your dashboard
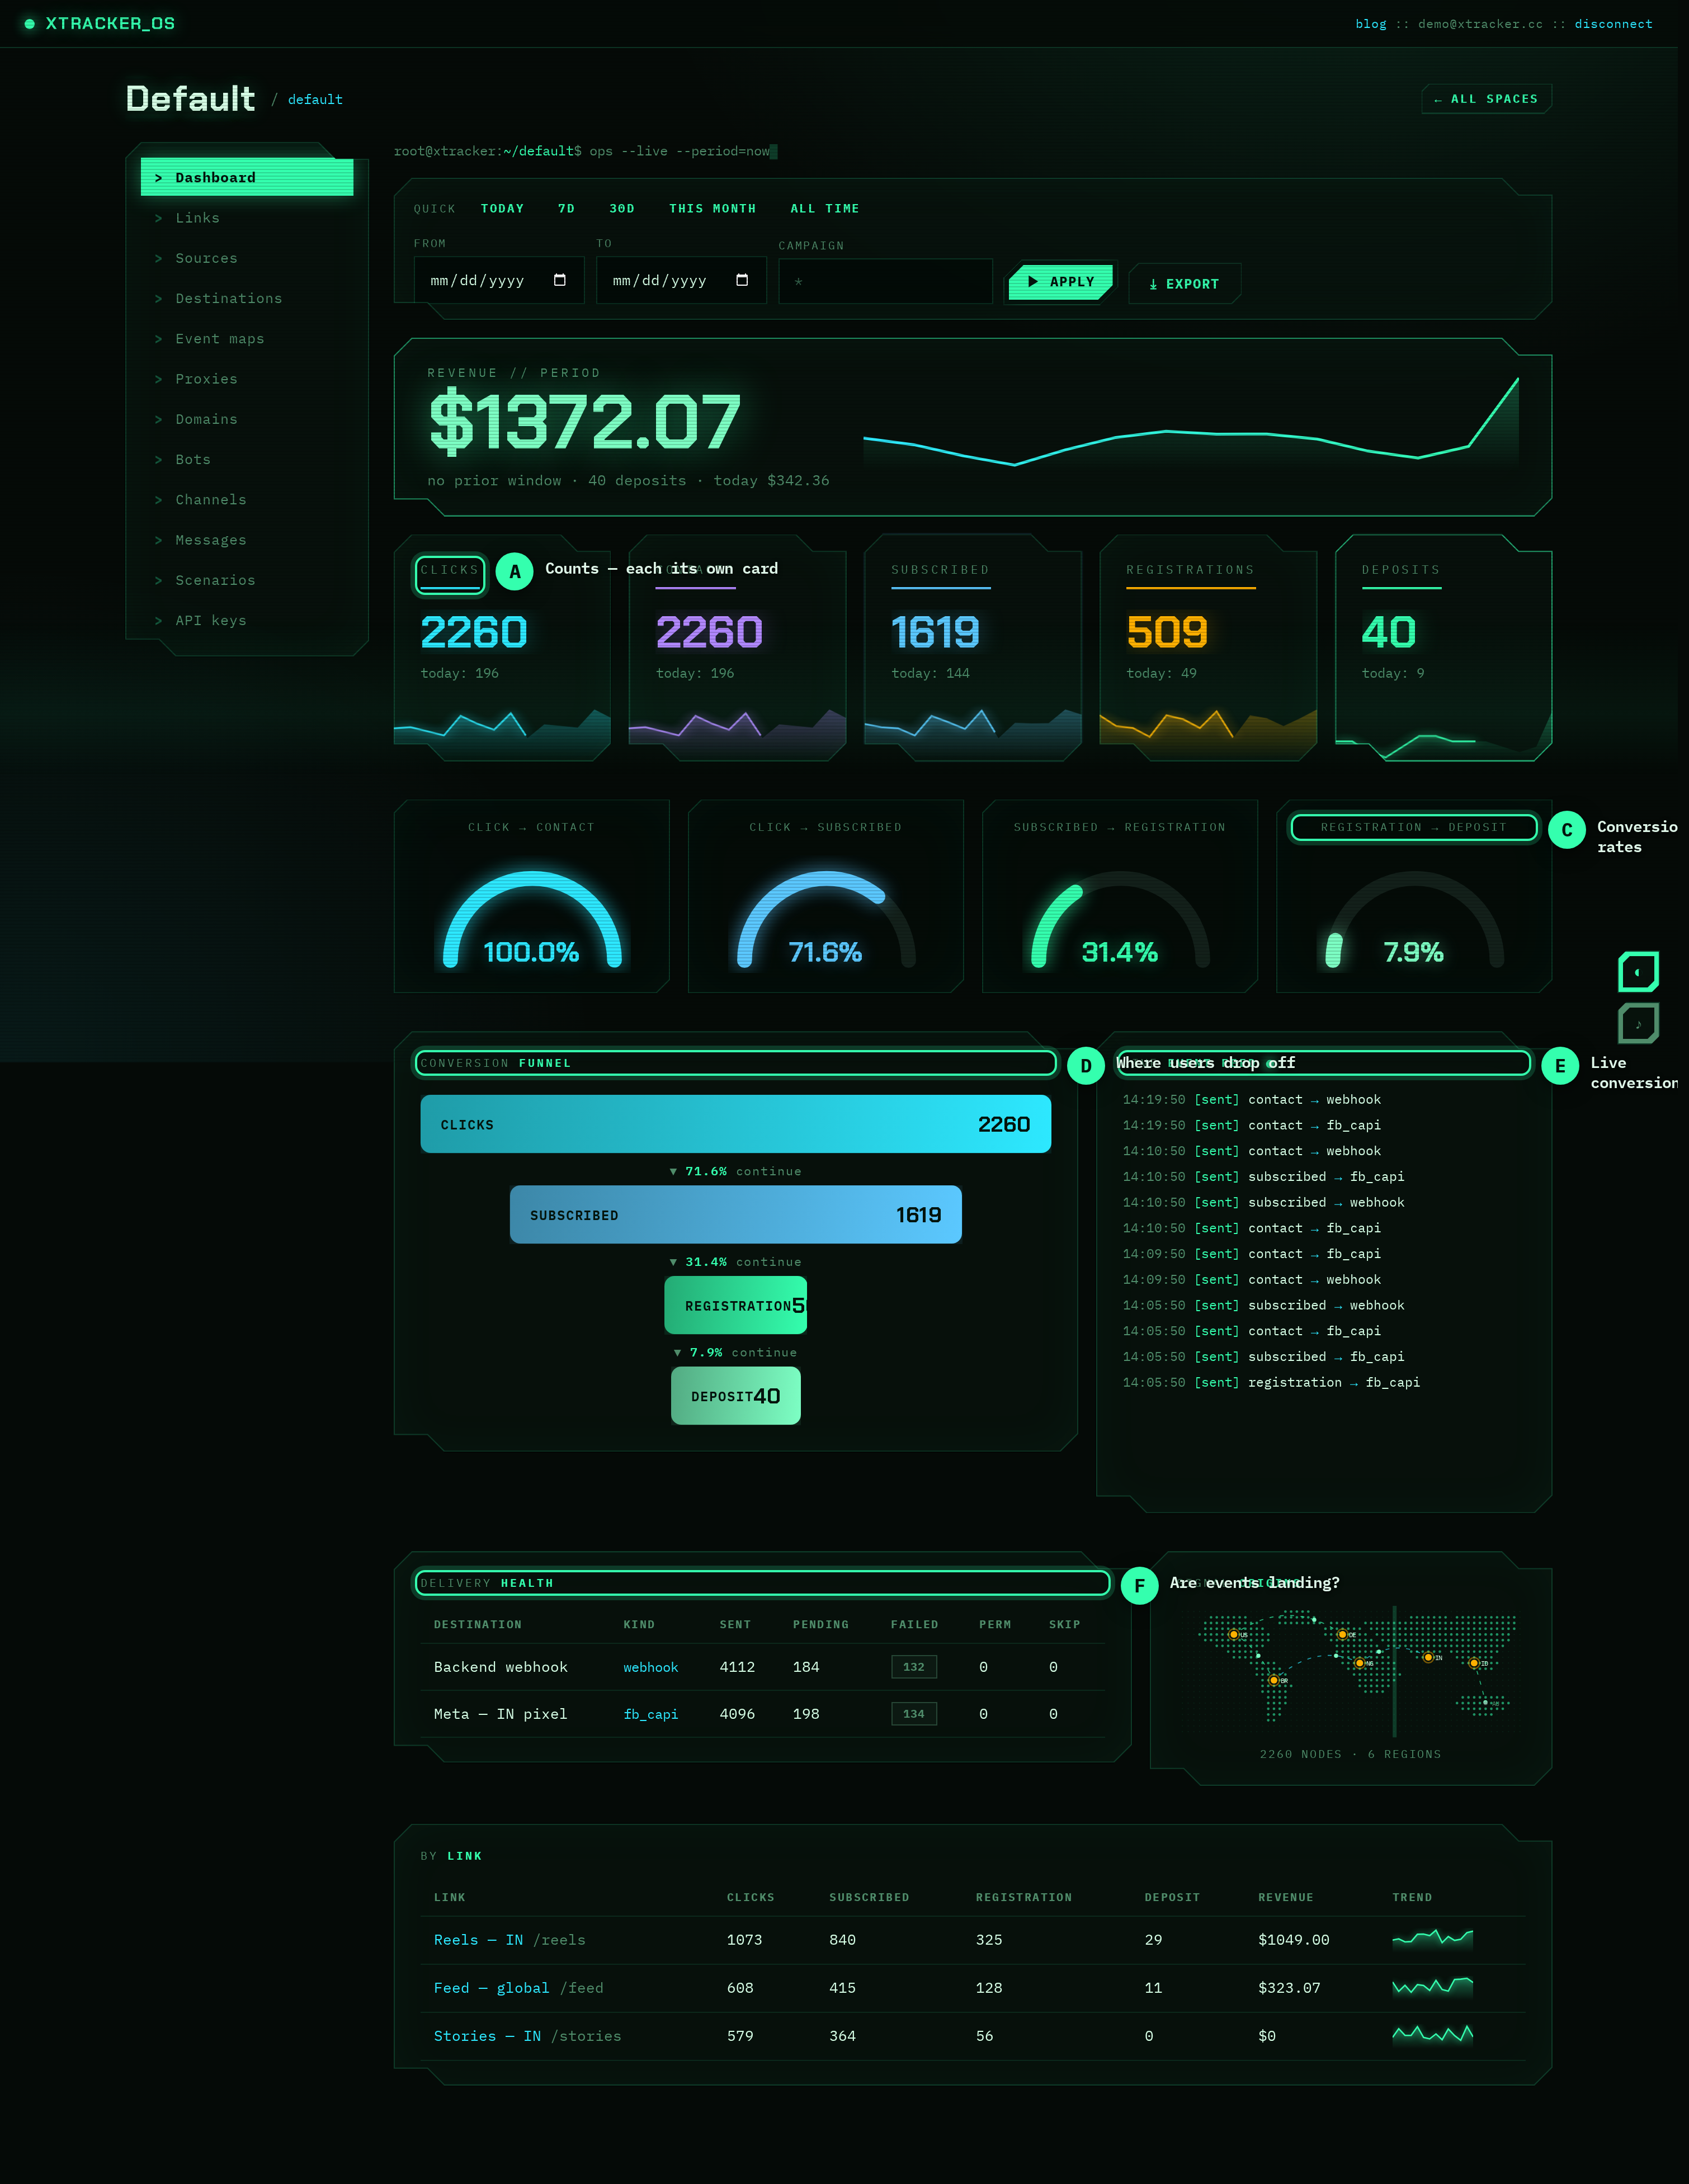
A tour of the XTRACKER ops deck: the conversion funnel, revenue and waveform, the cycling conversion gauge, live event feed, delivery matrix, world map and date filters.
The space dashboard — the "ops deck" — is a single live view of your funnel. Here's what each widget tells you.
Date filters
At the top, pick a window with the quick presets (Today, 7d, 30d, This month, All time) or set explicit From/To dates and an optional campaign filter. Everything below recomputes for that window. Revenue also shows a vs-previous delta comparing the equal-length window before it.
Total revenue + waveform
The big number is deposit revenue for the window. The waveform beneath it is daily revenue across the window, so you can see the shape of your earnings — spikes, dead days, trends — at a glance. The delta (▲/▼ %) compares against the previous period.
Funnel breakdown
Four bars — Clicks → Subscribed → Registration → Deposit — with absolute counts, scaled to clicks. This is your raw funnel: where the volume is and where it drops off.
Conversion gauge
The radial gauge cycles through the funnel's conversion ratios every few seconds: click→contact, click→subscribed, contact→registration, registration→deposit. The dots below let you pin a specific stage. It's the fastest way to spot which step is leaking.
Live event feed
A real-time stream of recent dispatches — deposit → webhook [sent], registration → fb_capi [sent], etc. It polls continuously, so you can watch conversions arrive while you test an integration.
Delivery matrix + health
The hex matrix and the delivery health table show, per destination, how many events were sent, pending, failed or failed_permanently. If conversions are firing but a destination shows failed_permanently, your token or URL is misconfigured.
Signal origins (world map)
A dot-matrix map with pins for the countries your clicks came from (derived from the edge's country header), with live counts. Good for spotting where your traffic actually lands versus where you targeted.
By-link table
Per-link totals — clicks, subscribed, registration, deposit, revenue — plus a 14-day sparkline of clicks. Use it to compare creatives/funnels side by side.
Export
The Export CSV button downloads the funnel summary for the current window, ready for a spreadsheet or a report.
Next
- Canonical events — what feeds these widgets.
- Destinations — what
sent/failedin delivery health means.
Keep reading
How to find and fix the leak in your funnel
A practical walkthrough: use the funnel breakdown and conversion gauge to pinpoint exactly where users drop off, form a hypothesis, fix one thing, and measure the lift.
PlaybookKeep your finger on the pulse: real-time conversion monitoring
A live dashboard isn't a vanity metric — it's an early-warning system. Here's how watching conversions in real time catches broken funnels and dead campaigns before they burn your budget.
PlaybookSame budget, more deposits: optimizing creatives with per-link data
Clicks lie. Deposits don't. Use per-link attribution to see which creative actually drives revenue — then move spend to the winner and kill the losers.