Keep your finger on the pulse: real-time conversion monitoring
A live dashboard isn't a vanity metric — it's an early-warning system. Here's how watching conversions in real time catches broken funnels and dead campaigns before they burn your budget.
It's Friday night. Your new campaign went live two hours ago. Are deposits coming in — or are you quietly setting money on fire? Without a live view, you find out Monday. With one, you find out now.
This is the case for keeping your finger on the pulse.
The whole funnel on one screen
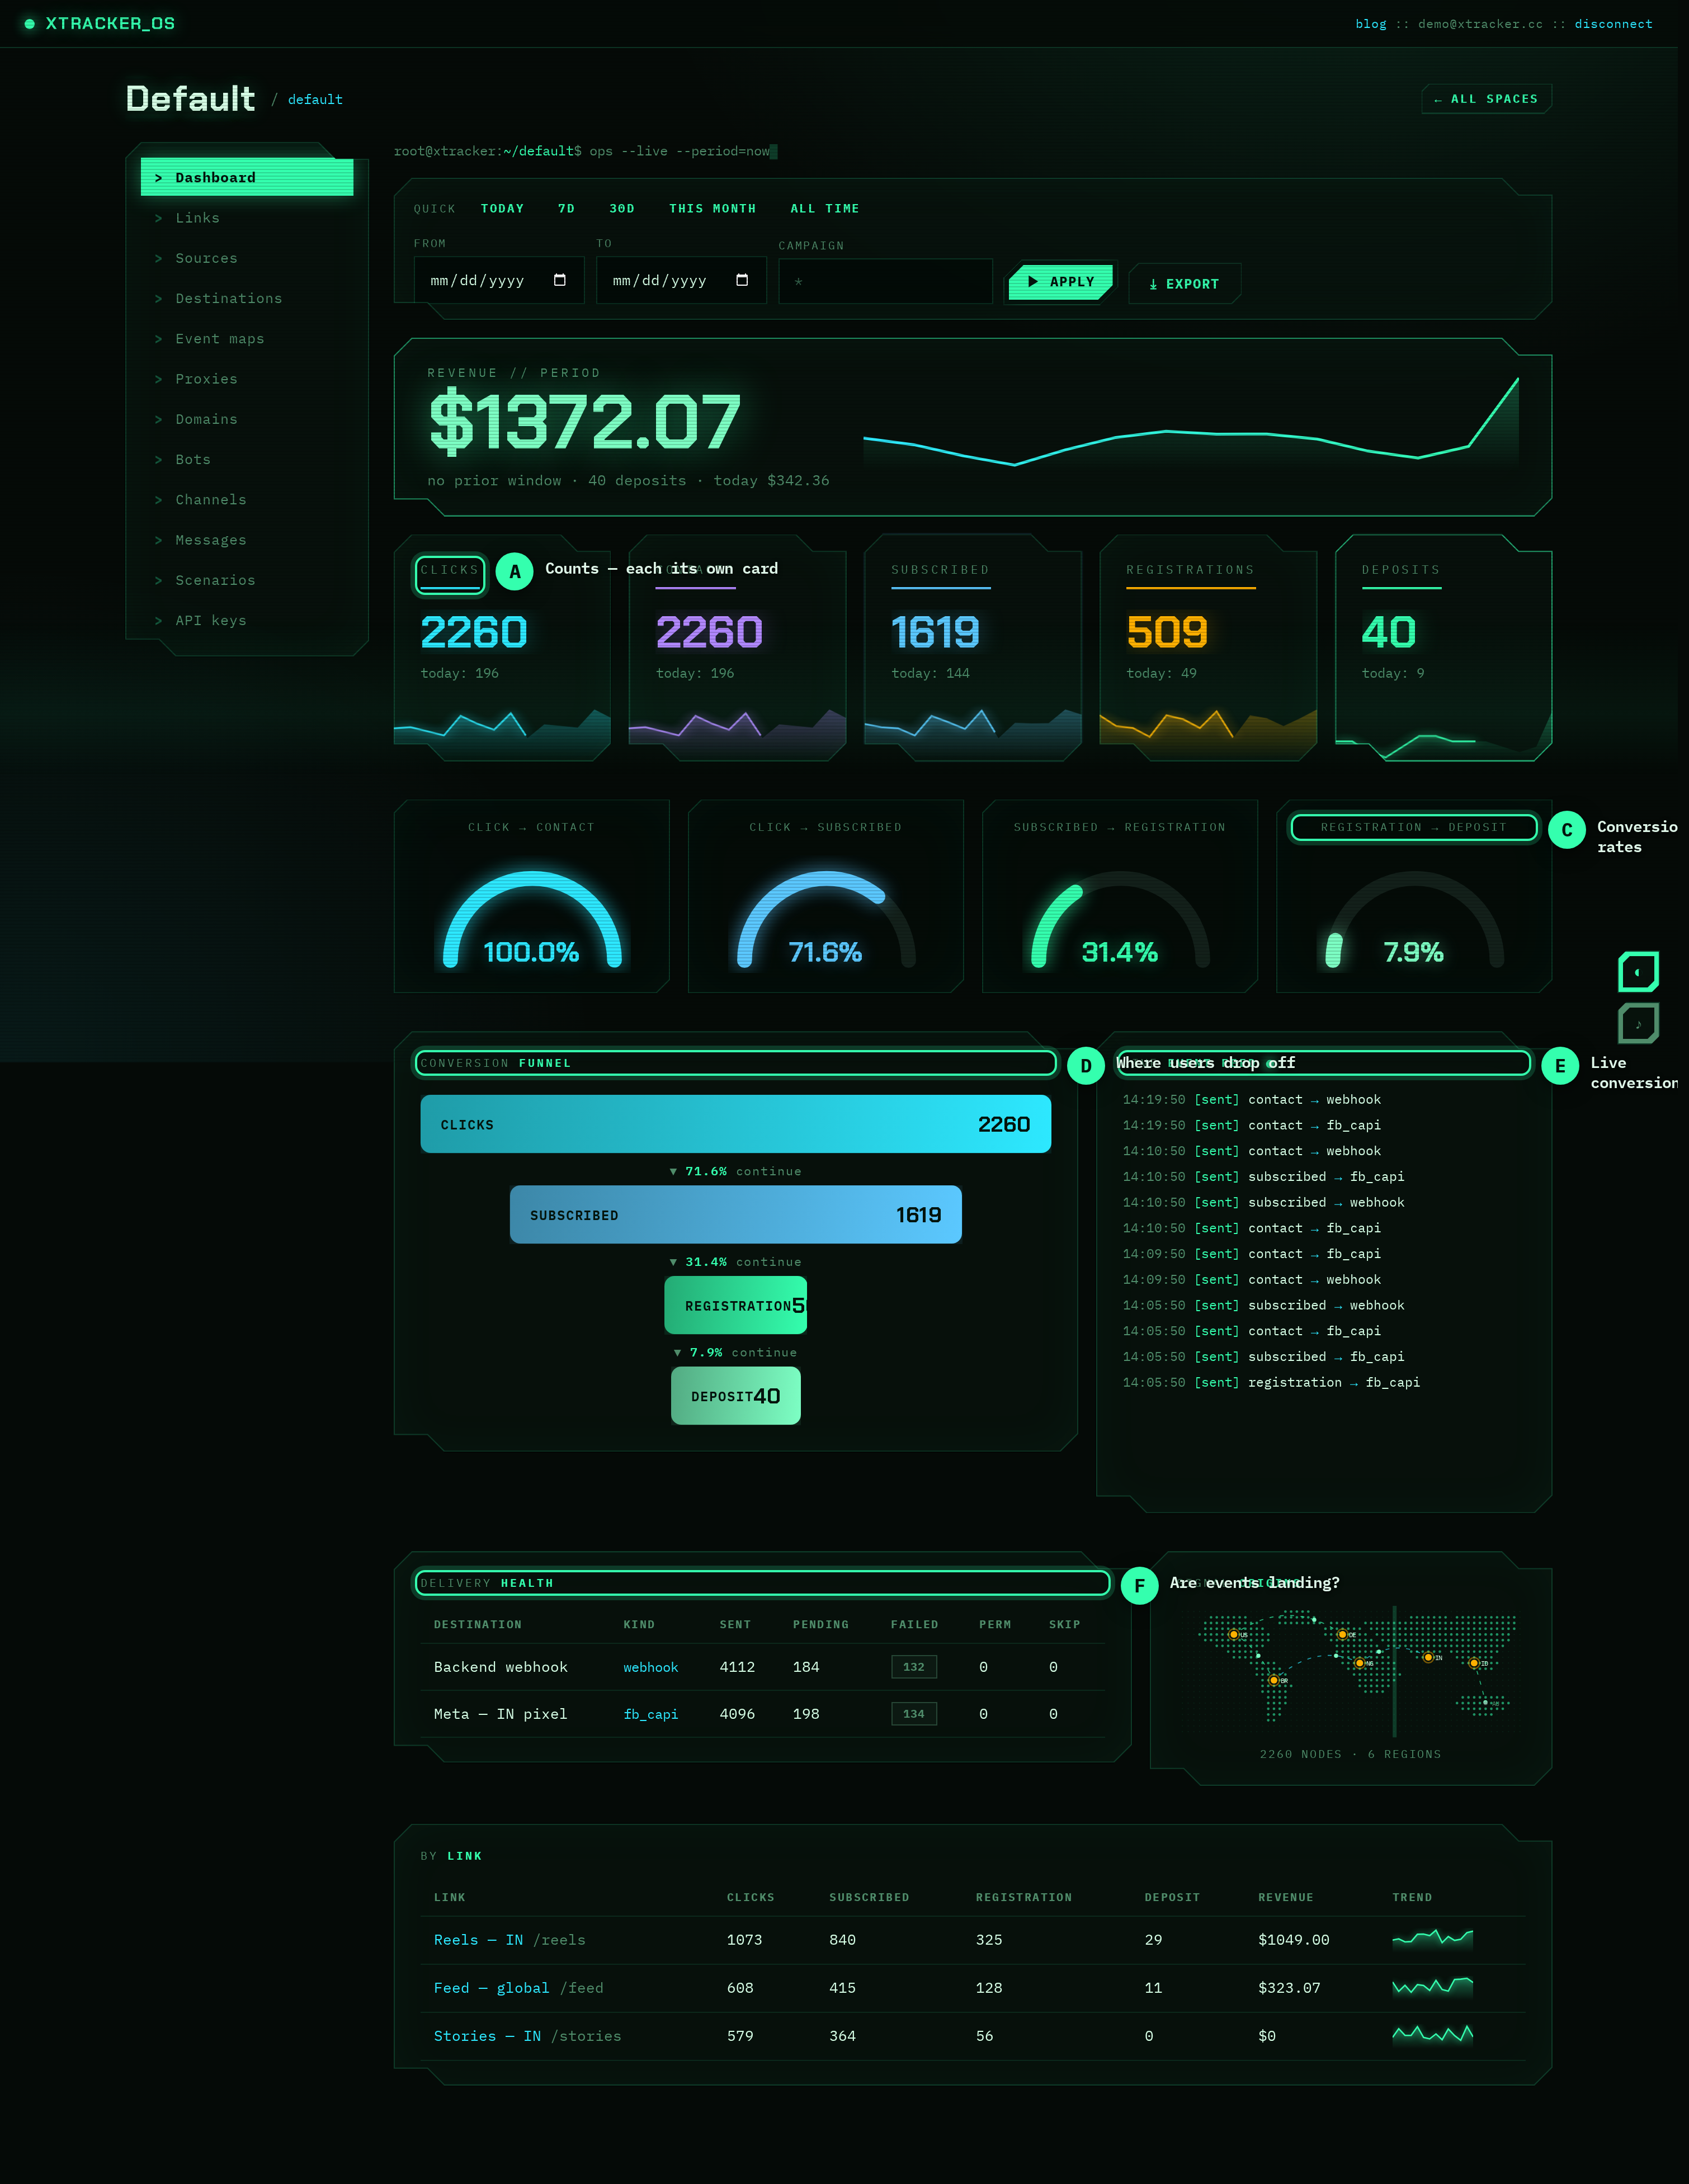
The ops deck shows every part of your funnel updating in real time — revenue, the funnel breakdown, the conversion gauge, the live event feed, and delivery health:
You don't read it like a report. You glance at it like a heartbeat monitor. Healthy looks like a certain shape; trouble looks different — and you learn the difference fast.
The live feed is your smoke detector
The most underrated widget is the live event feed. Every conversion that fires shows up within a second or two:
12:04:51  [sent]     deposit → fb_capi
12:04:48  [sent]     registration → webhook
12:04:31  [pending]  deposit → webhook
When you launch a campaign, you watch this feed. Three things it tells you instantly:
- Events are arriving → your integration works and traffic is converting.
- Events stopped → something upstream broke (ad disapproved, bot down, landing 500).
[failed]appearing → a destination is rejecting events (bad token, dead webhook).
A silent feed two hours into a launch is a five-alarm fire. You want to know at 12:05, not Monday.
The gauge points at the leak
The conversion gauge cycles through each step's ratio — click→contact, click→subscribed, contact→registration, registration→deposit. One of those numbers is always your weakest link:

When subscribed → registration reads 21% while everything else is healthy, you don't need a query — the gauge already pointed at the leak. Go fix the bot's first message or the offer CTA, then watch the number move.
Revenue with context
A revenue number alone is noise. The deck shows it with a waveform (the shape of your earnings across the window) and a vs-previous delta:
▲ 23% vs prev · 41 deposits
That delta is the difference between "we made $4,820" and "we made $4,820, up 23% on last week." One is a number; the other is a decision.
Delivery health: are conversions actually landing?
Tracking a deposit is only half the job — it has to reach Meta / your webhook / the network, or your optimization is blind. The delivery matrix shows sent / pending / failed / failed_permanently per destination. A wall of green is the goal; any failed_permanently is a misconfigured token or URL quietly dropping your conversions.
What "the pulse" actually buys you
- Catch breakage in minutes, not days — every hour of a dead funnel is wasted ad spend.
- Kill losers fast — if a campaign's feed is quiet, pause it before it drains the budget.
- Double down on winners in real time — when deposits spike, you see it and can scale while it's hot.
Make it a habit
Open the deck when you launch. Glance at it through the day. Filter to Today and keep the tab pinned. The whole point of real-time data is that it's real-time — the value evaporates if you only look once a week.
Next
- Reading your dashboard — every widget, explained.
- Find and fix funnel leaks — turn the gauge into action.
- Optimize creatives with per-link data — spend where it converts.
Keep reading
How to find and fix the leak in your funnel
A practical walkthrough: use the funnel breakdown and conversion gauge to pinpoint exactly where users drop off, form a hypothesis, fix one thing, and measure the lift.
PlaybookSame budget, more deposits: optimizing creatives with per-link data
Clicks lie. Deposits don't. Use per-link attribution to see which creative actually drives revenue — then move spend to the winner and kill the losers.
PlaybookThe deposit you almost counted twice
A story about exactly-once tracking: how retries and re-fired postbacks silently inflate (or lose) revenue, and how dedup + a durable outbox keep your numbers honest.